- Fact Sheet
Latinos in America: A Demographic Overview
Published

Latinos in the United States are a diverse and fast-growing group that is amassing considerable economic and political power. As data from the 2010 Census and other sources demonstrate, Latinos now account for one-sixth of the U.S. population. Most Latinos were born in this country, but over one-third are immigrants. Latinos as a whole (both foreign-born and native-born) are sizeable shares of the population and electorate in New Mexico, California, and Texas, but the fastest growing Latino populations are in South Carolina, Alabama, and Tennessee. The Mexican population is by far the largest in size, but the number of Spaniards is increasing the fastest. Latinos work in a diverse range of occupations, and nearly half of Latino households are owner occupied. Latinos also wield significant economic clout. Latino businesses and consumers sustain millions of jobs and add hundreds of billions of dollars in value to the U.S. economy.
The Latino population is growing fast and now accounts for one out of every six people.
- Between 2000 and 2010, the number of people in the United States who identified themselves as Latino grew from 35.3 million to 50.5 million (an increase of 43%) {Figure 1}.

- In 2010, Latinos comprised one-sixth (16.3%) of the total U.S. population—up from 12.5% in 2000 {Figure 2}.

Nearly two-thirds of Latinos are native-born.
- 62.9% of people who identified themselves as Latino were native-born in 2010 {Figure 3}.

More than one-quarter of foreign-born Latinos are naturalized U.S. citizens, but roughly half are unauthorized immigrants.
- 29.4% of foreign-born Latinos were naturalized U.S. citizens in 2010, meaning that they can vote {Figure 4}.
- Roughly half of foreign-born Latinos were unauthorized immigrants in 2010.

Just under one-third of foreign-born Latinos speak English “very well” or better.
- 31.6% of foreign-born Latinos age five and up reported speaking only English or speaking it “very well” in 2010 {Figure 5}.
- 27.5% of foreign-born Latinos age five and up reported speaking English “very well” in 2010.
- Another 4.1% of foreign-born Latinos age five and up reported speaking only English in 2010.

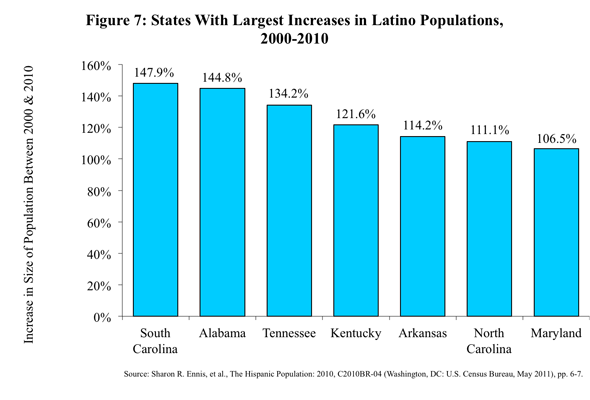
The states with the largest Latino population shares are New Mexico, California, and Texas, but the fastest growing Latino populations are in South Carolina, Alabama, and Tennessee.
- As of 2010, Latinos comprised 46.3% of the population in New Mexico, 37.6% in California and Texas, 29.6% in Arizona, 26.5% in Nevada, 22.5% in Florida, and 20.7% in Colorado {Figure 6}.

- Between 2000 and 2010, the Latino population increased in size by 147.9% in South Carolina, 144.8% in Alabama, 134.2% in Tennessee, 121.6% in Kentucky, 114.2% in Arkansas, 111.1% in North Carolina, and 106.5% in Maryland {Figure 7}.
Mexicans comprise the largest group of Latinos, but the number of Spaniards is growing the fastest.
- As of 2010, 31.8 million Latinos identified themselves as being of Mexican origin, 4.6 million Puerto Rican, 1.8 million Cuban, 1.6 million Salvadoran, 1.4 million Dominican, and one million Guatemalan. {Figure 8}

- Between 2000 and 2010, the Spanish population grew by 534.4%, the Uruguayan by 202.5%, the Honduran by 191.1%, the Guatemalan by 180.3%, the Salvadoran by 151.7%, the Bolivian by 135.8%, and the Venezuelan by 135% {Figure 9}.

One-eighth of Latinos have a bachelor’s degree or more education.
- 8.9% of Latinos age 25 and over had a bachelor’s degree only in 2010, while another 4.1% had a graduate degree {Figure 10}. In comparison, 17.7% of the U.S. population as a whole age 25 and over had a bachelor’s degree only in 2010, while 10.4% had a graduate degree.
- More than one-third (37.8%) of Latinos age 25 and over lacked a high-school diploma in 2010 {Figure 10}. In comparison, 14.4% of the U.S. population as a whole age 25 and over lacked a high-school diploma in 2010.

Nearly half of Latinos work in service, sales, and office occupations.
- More than one-quarter (26.6%) of Latino workers age 16 and over worked in service occupations in 2010, followed by sales and office occupations (22.3%), management, business, and science occupations (19%), production and transportation occupations (16.6%), and construction and maintenance occupations (15.5%) {Figure 11}.

Nearly half of Latino households are owner occupied.
- 47.1% of Latino households were owner occupied in 2010, nearly the same as the 45.7% share in 2000.
The Latino share of the electorate is growing.
- There were 6.6 million Latino voters in the 2010 mid-term elections, up from 5.6 million in the 2006 mid-terms.
- In 2010, Latinos were 6.9% of all voters, up from 5.8% in 2006.
- Latinos comprised 31.6% of all voters in New Mexico in 2010, 19.2% in California, and 18.1% in Texas.
Latinos contribute significantly to the economy through their consumer purchasing power and entrepreneurship.
- The nation’s 2.3 million Latino-owned businesses had sales and receipts of $350.7 billion and employed 1.9 million people in 2007 (the last year for which data is available).
- The purchasing power of Latinos totaled $1 trillion in 2010 (an increase of 392.9% since 1990), and is projected to reach $1.5 trillion by 2015.
Help us fight for immigration justice!
The research is clear – immigrants are more likely to win their cases with a lawyer by their side. But very few can get attorneys.
Introducing the Immigration Justice Campaign Access Fund.
Your support sends attorneys, provides interpreters, and delivers justice.
Immigration Justice Campaign is an initiative of American Immigration Council and American Immigration Lawyers Association. The mission is to increase free legal services for immigrants navigating our complicated immigration system and leverage the voices and experiences of those most directly impacted by our country’s immigration policies to inform legal and advocacy strategies. We bring together a broad network of volunteers who provide legal assistance and advocate for due process for immigrants with a humane approach that includes universal legal representation and other community-based support for individuals during their immigration cases.