- Fact Sheet
Immigrants in Oregon
Published
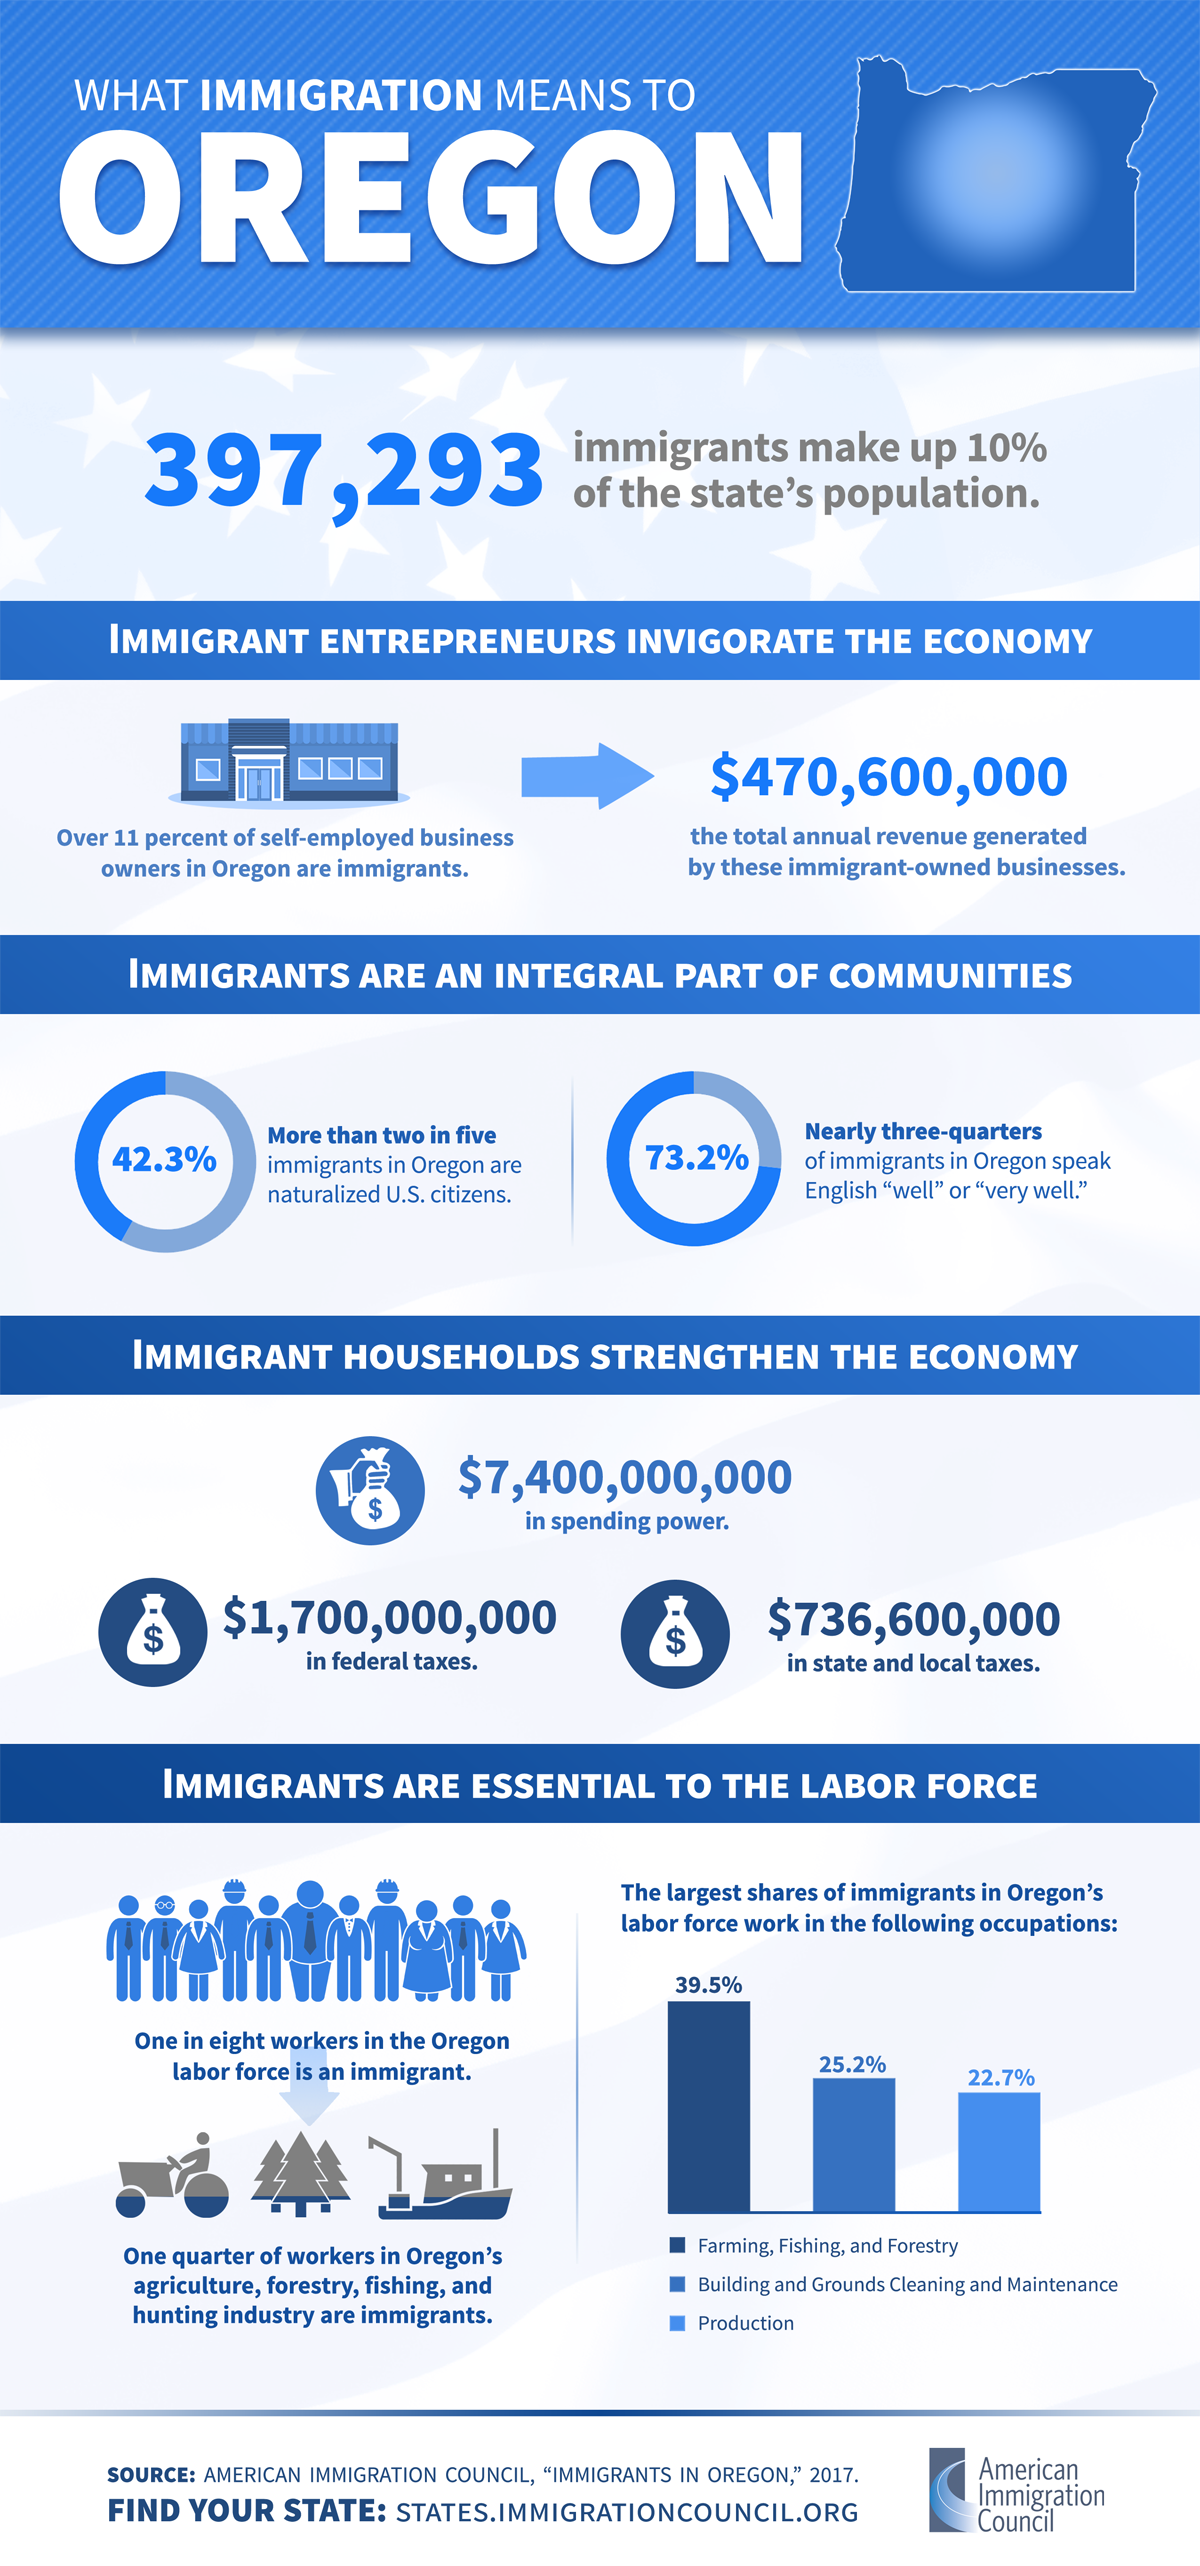
Oregon has a sizeable community of immigrants, many hailing from Mexico. One out of every ten Oregon residents is foreign-born, while one in nine residents is a native-born American who has at least one immigrant parent. More than two-fifths of Oregon’s farmers, fishers, and foresters are immigrants, as are over one-fifth of all production employees. As neighbors, business owners, taxpayers, and workers, immigrants are an integral part of Oregon’s diverse and thriving communities and make extensive contributions that benefit all.
One in ten Oregon residents is an immigrant, while one in nine residents is a native-born U.S. citizen with at least one immigrant parent.
- In 2018, 432,410 immigrants (foreign-born individuals) comprised 10 percent of the population.
- Oregon was home to 208,338 women, 199,905 men, and 24,167 children who were immigrants.
- The top countries of origin for immigrants were Mexico (36 percent of immigrants), Vietnam (6 percent), China (5 percent), India (5 percent), and the Philippines (4 percent).
- In 2018, 459,872 people in Oregon (11 percent of the state’s population) were native-born Americans who had at least one immigrant parent.
More than two in five immigrants in Oregon are naturalized U.S. citizens.
- 195,759 immigrants (45 percent) had naturalized as of 2018, and 84,098 immigrants were eligible to become naturalized U.S. citizens in 2017.
- About three in four (74 percent) immigrants reported speaking English “well” or “very well.”
Immigrants in Oregon are distributed across the educational spectrum.
- More than a quarter (29 percent) of adult immigrants had a college degree or more education in 2018, while nearly a third (31 percent) had less than a high school diploma.
|
Education Level |
Share (%) of All Immigrants |
Share (%) of All Natives |
|---|---|---|
|
College degree or more |
29 |
35 |
|
Some college |
21 |
36 |
|
High school diploma only |
19 |
23 |
|
Less than a high school diploma |
31 |
6 |
|
Source: U.S. Census Bureau, 2018 American Community Survey 1-Year Estimates. |
||
Nearly 90,000 U.S. citizens in Oregon live with at least one family member who is undocumented.
- 110,000 undocumented immigrants comprised 26 percent of the immigrant population and 3 percent of the total state population in 2016.
- 186,460 people in Oregon, including 89,520 U.S. citizens, lived with at least one undocumented family member between 2010 and 2014.
- During the same period, about 1 in 12 children in the state was a U.S. citizen living with at least one undocumented family member (71,208 children in total).
Oregon is home to almost 10,000 Deferred Action for Childhood Arrivals (DACA) recipients.
- 9,710 active DACA recipients lived in Oregon as of March 2020, while DACA has been granted to 12,060 people in total since 2012.
- As of 2019, 68 percent of DACA-eligible immigrants in Oregon had applied for DACA.
- An additional 4,000 residents of the state would satisfy all but the educational requirements for DACA, and fewer than 1,000 would become eligible as they grew older.
One in eight workers in Oregon is an immigrant, together making up a vital part of the state’s labor force across industries.
- 276,237 immigrant workers comprised 13 percent of the labor force in 2018.
- Immigrant workers were most numerous in the following industries:
|
Industry |
Number of Immigrant Workers |
|---|---|
|
Manufacturing |
55,584 |
|
Health Care and Social Assistance |
37,248 |
|
Accommodation and Food Services |
34,383 |
|
Retail Trade |
26,504 |
|
Agriculture, Forestry, Fishing, and Hunting |
22,844 |
|
Source: Analysis of the U.S. Census Bureau’s 2018 American Community Survey 1-year PUMS data by the American Immigration Council. |
|
- The largest shares of immigrant workers were in the following industries:
|
Industry |
Immigrant Share (%) |
|---|---|
|
Agriculture, Forestry, Fishing, and Hunting |
28 |
|
Manufacturing |
21 |
|
Administrative & Support; Waste Management; and Remediation Services |
18 |
|
Accommodation and Food Services |
16 |
|
Construction |
14 |
|
Source: Analysis of the U.S. Census Bureau’s 2018 American Community Survey 1-year PUMS data by the American Immigration Council. |
|
Immigrants are an integral part of the Oregon workforce in a range of occupations.
- In 2018, immigrant workers were most numerous in the following occupation groups:
|
Occupation Category |
Number of Immigrant Workers |
|---|---|
|
Production |
30,318 |
|
Food Preparation and Serving Related |
25,856 |
|
Transportation and Material Moving |
24,499 |
|
Building and Grounds Cleaning & Maintenance |
22,778 |
|
Management |
21,968 |
|
Source: Analysis of the U.S. Census Bureau’s 2018 American Community Survey 1-year PUMS data by the American Immigration Council. |
|
- The largest shares of immigrant workers were in the following occupation groups:
|
Occupation Category |
Immigrant Share (%) |
|---|---|
|
Farming, Fishing, and Forestry |
43 |
|
Building and Grounds Cleaning & Maintenance |
25 |
|
Production |
22 |
|
Architecture and Engineering |
20 |
|
Construction and Extraction |
18 |
|
Source: Analysis of the U.S. Census Bureau’s 2018 American Community Survey 1-year PUMS data by the American Immigration Council. |
|
- Undocumented immigrants comprised 4 percent of Oregon’s workforce in 2016.
Immigrants in Oregon have contributed billions of dollars in taxes.
- Immigrant-led households in the state paid $2.8 billion in federal taxes and $1.3 billion in state and local taxes in 2018.
- Undocumented immigrants in Oregon paid an estimated $205 million in federal taxes and $120.2 million in state and local taxes in 2018.
- Oregon DACA recipients and DACA-eligible individuals paid an estimated $18.4 million in state and local taxes in 2018.
As consumers, immigrants add billions of dollars to Oregon’s economy.
- Oregon residents in immigrant-led households had $11 billion in spending power (after-tax income) in 2018.
Immigrant entrepreneurs in Oregon generate hundreds of millions of dollars in business revenue.
- 29,857 immigrant business owners accounted for 11 percent of all self-employed Oregon residents in 2018 and generated $766.4 million in business income.
- In 2018, immigrants accounted for 11 percent of business owners in the Portland/Vancouver/Beaverton metropolitan area, which spans Oregon and Washington.
Help us fight for immigration justice!
The research is clear – immigrants are more likely to win their cases with a lawyer by their side. But very few can get attorneys.
Introducing the Immigration Justice Campaign Access Fund.
Your support sends attorneys, provides interpreters, and delivers justice.
Immigration Justice Campaign is an initiative of American Immigration Council and American Immigration Lawyers Association. The mission is to increase free legal services for immigrants navigating our complicated immigration system and leverage the voices and experiences of those most directly impacted by our country’s immigration policies to inform legal and advocacy strategies. We bring together a broad network of volunteers who provide legal assistance and advocate for due process for immigrants with a humane approach that includes universal legal representation and other community-based support for individuals during their immigration cases.