- Fact Sheet
Immigrants in South Carolina
Published
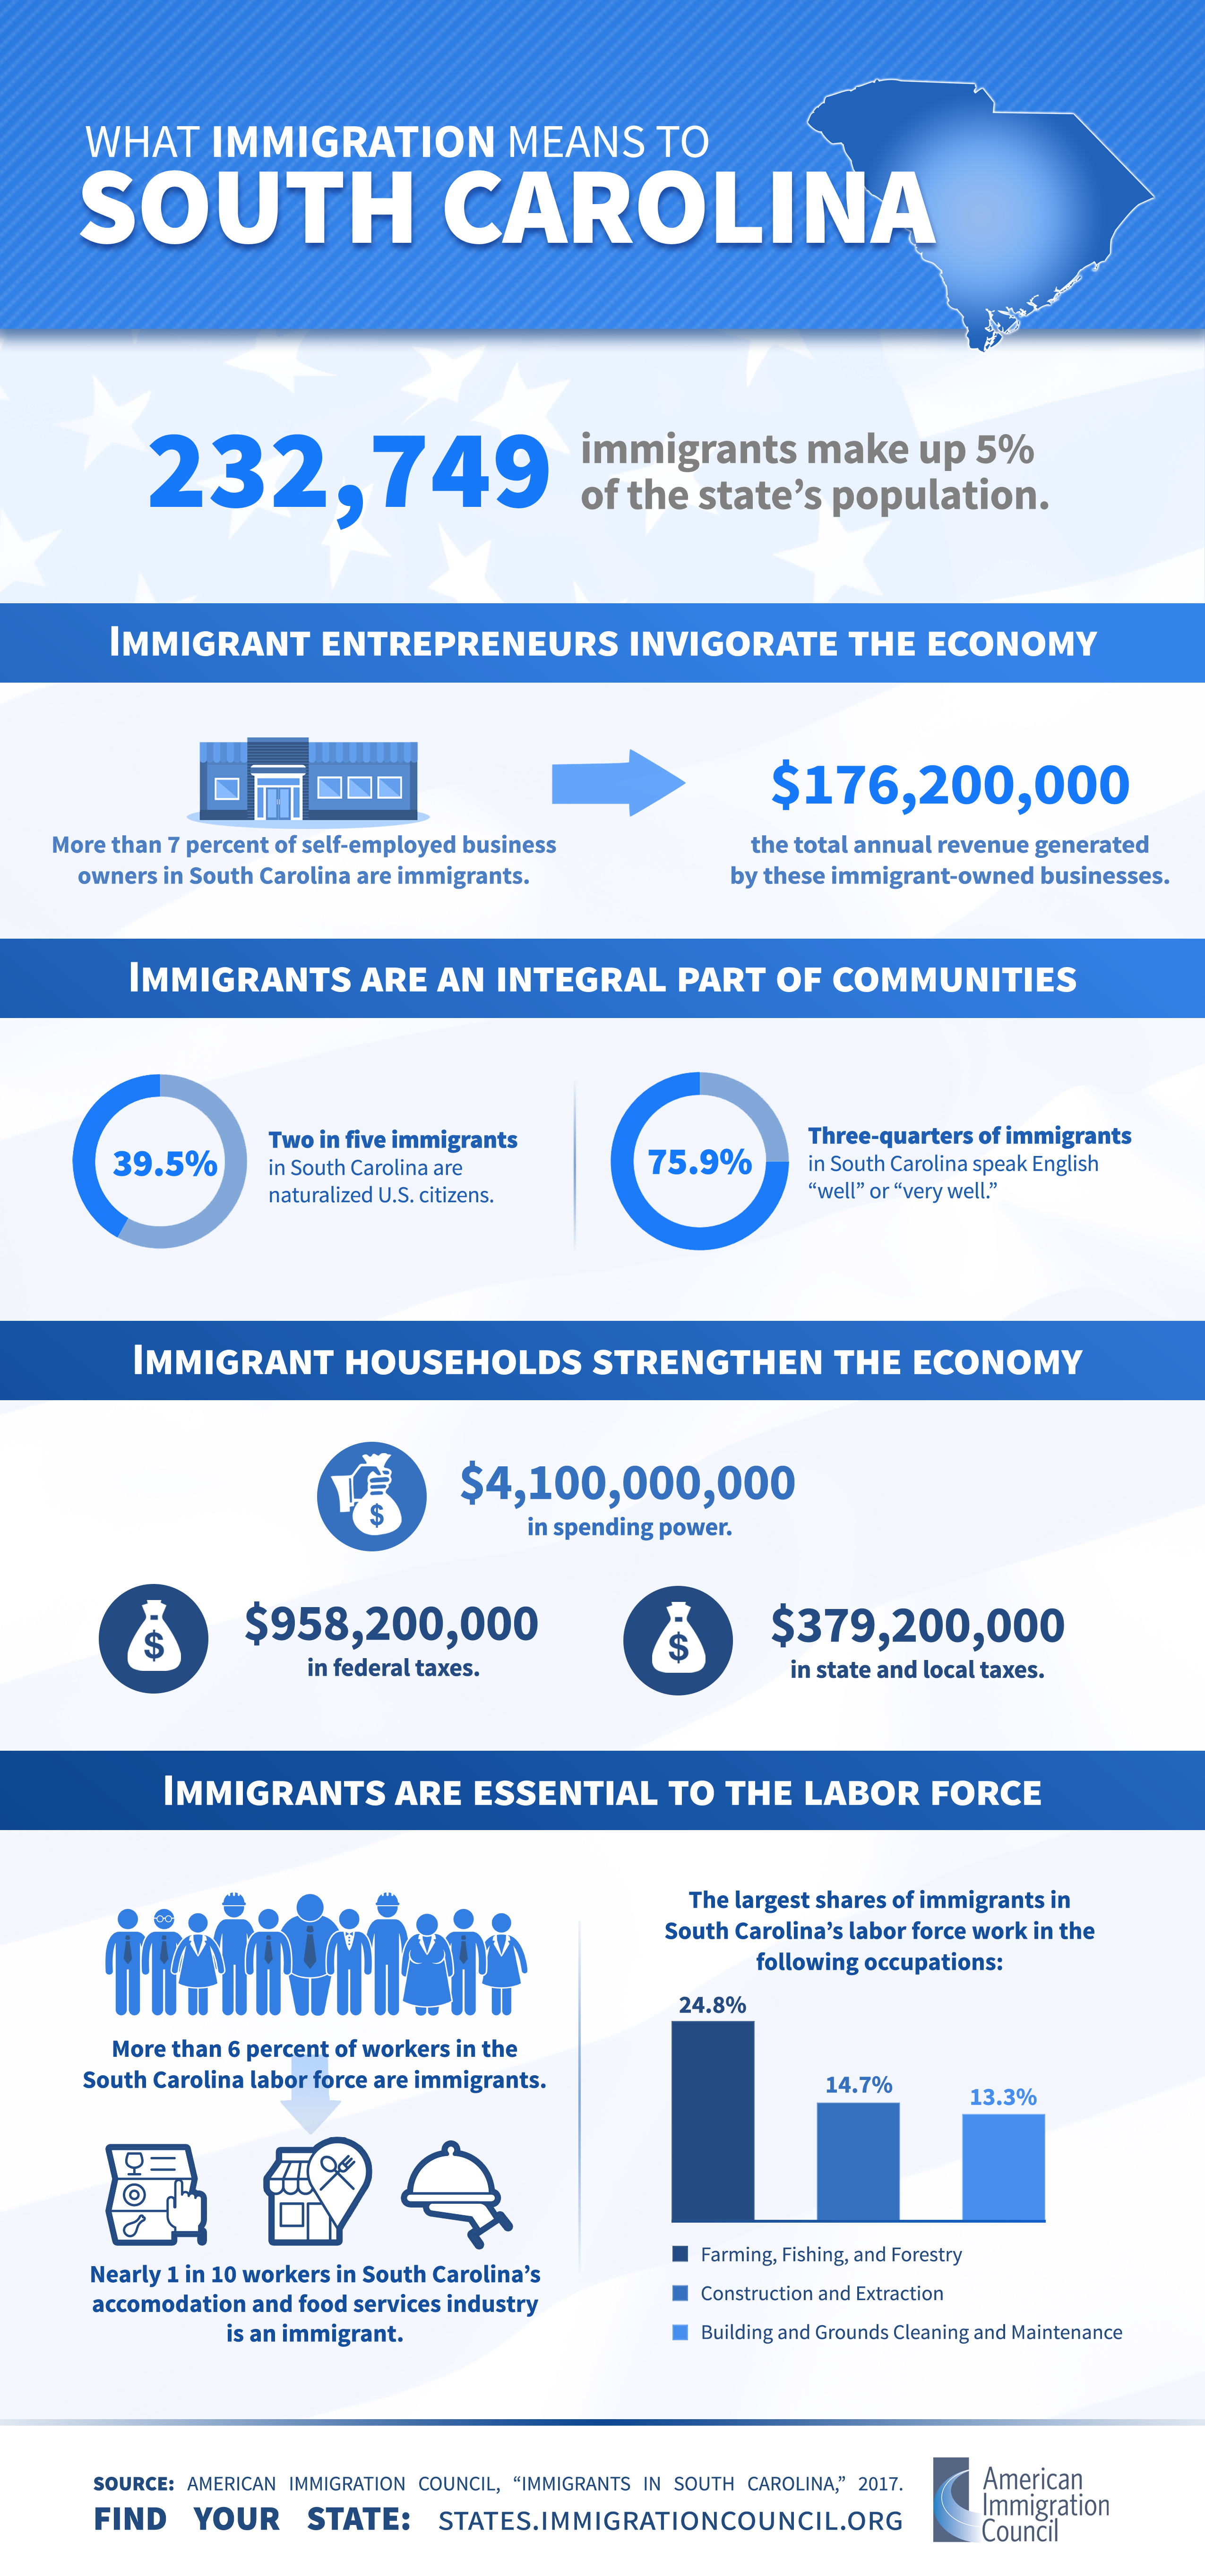
South Carolina has a small but growing immigrant population. While 1 in 20 South Carolinians is an immigrant, foreign-born residents make up a vital, educated share of the state's labor force. Combined, immigrants account for one-fifth of all residents working in fishing, forestry, and farming, as well as 17 percent in construction and extraction jobs. The majority of immigrants speak English well and are naturalized citizens or eligible for naturalization. As neighbors, business owners, taxpayers, and workers, immigrants are an integral part of South Carolina’s diverse and thriving communities and make extensive contributions that benefit all.
Five percent of South Carolina residents are immigrants, while nearly 5 percent of residents are native-born U.S. citizens with at least one immigrant parent.
- In 2018, 256,765 immigrants (foreign-born individuals) comprised 5 percent of the population.
- South Carolina was home to 117,404 women, 119,994 men, and 19,367 children who were immigrants.
- The top countries of origin for immigrants were Mexico (24 percent of immigrants), India (7 percent), Germany (5 percent), Honduras (5 percent), and the Philippines (5 percent).
- In 2018, 213,949 people in South Carolina (4 percent of the state’s population) were native-born Americans who had at least one immigrant parent.
More than two out of five immigrants in South Carolina are naturalized U.S. citizens.
- 111,188 immigrants (43 percent) had naturalized as of 2018, and 40,424 immigrants were eligible to become naturalized U.S. citizens in 2017.
- Four in five (80 percent) immigrants reported speaking English “well” or “very well.”
Immigrants in South Carolina are distributed across the educational spectrum.
- One-third (33 percent) of adult immigrants had a college degree or more education in 2018, while more than one-fifth (22 percent) had less than a high school diploma.
|
Education Level |
Share (%) of All Immigrants |
Share (%) of All Natives |
|---|---|---|
|
College degree or more |
33 |
28 |
|
Some college |
19 |
31 |
|
High school diploma only |
27 |
30 |
|
Less than a high school diploma |
22 |
11 |
|
Source: U.S. Census Bureau, 2018 American Community Survey 1-Year Estimates. |
||
Tens of thousands of U.S. citizens in South Carolina live with at least one family member who is undocumented.
- 85,000 undocumented immigrants comprised 35 percent of the immigrant population and 2 percent of the total state population in 2016.
- 107,798 people in South Carolina, including 49,729 U.S. citizens, lived with at least one undocumented family member between 2010 and 2014.
- During the same period, about 4 percent of children in the state were U.S. citizens living with at least one undocumented family member (40,205 children in total).
South Carolina is home to thousands of Deferred Action for Childhood Arrivals (DACA) recipients.
- 5,750 active DACA recipients lived in South Carolina as of March 2020, while DACA has been granted to 6,930 people in total since 2012.
- As of 2019, 65 percent of DACA-eligible immigrants in South Carolina had applied for DACA.
- An additional 4,000 residents of the state would satisfy all but the educational requirements for DACA, and fewer than 1,000 would become eligible as they grew older.
Immigrants are an important part of the South Carolina workforce across industries.
- 158,772 immigrant workers comprised 6 percent of the labor force in 2018.
- Immigrant workers were most numerous in the following industries:
|
Industry |
Number of Immigrant Workers |
|---|---|
|
Construction |
27,696 |
|
Manufacturing |
27,605 |
|
Accommodation and Food Services |
22,392 |
|
Health Care and Social Assistance |
15,517 |
|
Retail Trade |
14,748 |
|
Source: Analysis of the U.S. Census Bureau’s 2018 American Community Survey 1-year PUMS data by the American Immigration Council. |
|
- The largest shares of immigrant workers were in the following industries:
|
Industry |
Immigrant Share (%) |
|---|---|
|
Construction |
14 |
|
Agriculture, Forestry, Fishing, and Hunting |
11 |
|
Accommodation and Food Services |
8 |
|
Administrative & Support; Waste Management; and Remediation Services |
8 |
|
Manufacturing |
8 |
|
Source: Analysis of the U.S. Census Bureau’s 2018 American Community Survey 1-year PUMS data by the American Immigration Council. |
|
Immigrants are an integral part of the South Carolina workforce in a range of occupations.
- In 2018, immigrant workers were most numerous in the following occupation groups:
|
Occupation Category |
Number of Immigrant Workers |
|---|---|
|
Construction and Extraction |
25,021 |
|
Building and Grounds Cleaning & Maintenance |
17,956 |
|
Production |
15,893 |
|
Food Preparation and Serving Related |
15,123 |
|
Management |
14,693 |
|
Source: Analysis of the U.S. Census Bureau’s 2018 American Community Survey 1-year PUMS data by the American Immigration Council. |
|
- The largest shares of immigrant workers were in the following occupation groups:
|
Occupation Category |
Immigrant Share (%) |
|---|---|
|
Farming, Fishing, and Forestry |
20 |
|
Construction and Extraction |
17 |
|
Building and Grounds Cleaning & Maintenance |
13 |
|
Architecture and Engineering |
10 |
|
Computer and Mathematical |
10 |
|
Source: Analysis of the U.S. Census Bureau’s 2018 American Community Survey 1-year PUMS data by the American Immigration Council. |
|
- Undocumented immigrants comprised 3 percent of South Carolina’s workforce in 2016.
Immigrants in South Carolina have contributed billions of dollars in taxes.
- Immigrant-led households in the state paid $1.5 billion in federal taxes and $635.4 million in state and local taxes in 2018.
- Undocumented immigrants in South Carolina paid an estimated $99.4 million in federal taxes and $60.8 million in state and local taxes in 2018.
- South Carolina DACA recipients and DACA-eligible individuals paid an estimated $11.1 million in state and local taxes in 2018.
As consumers, immigrants add billions of dollars to South Carolina’s economy.
- South Carolina residents in immigrant-led households had $5.9 billion in spending power (after-tax income) in 2018.
Immigrant entrepreneurs in South Carolina generate hundreds of millions of dollars in business revenue.
- 23,670 immigrant business owners accounted for 10 percent of all self-employed South Carolina residents in 2018 and generated $719.6 million in business income.
- In 2018, immigrants accounted for 15 percent of business owners in the Charlotte/Gastonia/Concord metropolitan area, which spans North Carolina and South Carolina.
Help us fight for immigration justice!
The research is clear – immigrants are more likely to win their cases with a lawyer by their side. But very few can get attorneys.
Introducing the Immigration Justice Campaign Access Fund.
Your support sends attorneys, provides interpreters, and delivers justice.
Immigration Justice Campaign is an initiative of American Immigration Council and American Immigration Lawyers Association. The mission is to increase free legal services for immigrants navigating our complicated immigration system and leverage the voices and experiences of those most directly impacted by our country’s immigration policies to inform legal and advocacy strategies. We bring together a broad network of volunteers who provide legal assistance and advocate for due process for immigrants with a humane approach that includes universal legal representation and other community-based support for individuals during their immigration cases.